Fabrication Shop Evaluate
Summary
This report summarises opportunities identified for reducing fabrication times as part of the Velocity Project aim to increase the speed of ordered parts through the system by 30%.
The critical understanding, on which all else hinges in the fabrication business, is that value is only added when a flame or arc is burning to make the first-pass product, in an efficient and effective manner. Every other activity is an expense and a cost. There was plentiful opportunity to save thousands of hours of time annually in Fabrication if the removal of waste from all activities wais made a priority.
The information collected and developed during investigations into potential improvement opportunities is enclosed in the body of the report. The recommendations garnered from the investigation are listed in the following Interim Recommendations.
Interim Recommendations
- Senior management must make a believable plan of how they will achieve the stated aims of the Velocity Project. This plan needs to clearly be a Top Management initiative that they are prepared to see through to the end. It is critically important to send the 'right signals' to the workforce so they can believe the change is more than another fad.
- The 'thinking' within the organisation is steeped in 1970's practices and is vastly out of date with best practices now available. This 'thinking' needs to be brought into the present through a well structured and organised change management program that brings best practices into use by the management and people in the
- The recommended approach to lift 'thinking' to that necessary to achieve the Velocity Project aim is to introduce Lean Manufacturing training and the associated methods of waste reduction into the management and workforce. The truth is that the men on the shop floor know what needs to be done to improve productivity. They only need management supported and endorsed system that allows the ideas to be developed and
- The introduction of Work in Process (WIP) before the need for it should be stopped. No plate should be cut earlier than its necessary lead time. This requires far more certain planning/scheduling and parts management practices than are now used, along with a guaranteed means to ensure that necessary raw material is available from Suppliers and the Warehouse when it is
- Extend the Velocity Project Scope to cover the time losses and wastes across the entire supply chain process from Customer Purchase Approval to Customer Product
- Relocate two motorised jig cranes from High Bay to Low Bay at the plate joining work station and the rack assembly workstation using people from the workforce and the workshop electrician so sub-two-tonne lifts can be done without the need of overhead cranes (See diagram on the last page of this section).
- Move a manual jib crane freed-up from Recommendation 6 to the sub-arc bay so the sub-arc Buggo bench does not need to be lifted by overhead crane (See diagram on the last page of this section).
- Following the completion of recommendation, No 6 put work weighing more than 500kg and less than 2000kg into workstations with the motorised jib cranes as much as possible so the overhead cranes are not needed so
- Ensure that work on assemblies weighing more than 20kg and less than 500kg is done in the workstations with manual jib cranes so the overhead cranes are not needed so
- Do work on assemblies which can be manually lifted in an area without a jib crane, so the jib cranes are available to use for heavier
- Complete the analysis of the causes of ' non-arc time' identified in the Time Losses of Table 1 for large fabrication and Pareto Chart the causes to target biggest improvement
- Introduce a 'supermarket' between Profile Cutter and the rest of the fabrication shop and only replenish the supermarket when space becomes available as the material is drawn from the front (See diagram on the last page of this section). To allow this to happen to make approved heavy-duty carry cradles into which all cut parts for a job are placed so they can be put into the supermarket for easy retrieval and movement to work stations throughout the works
- Get the Profile Cutter flames bevelling function operational and into use, as an automated process will always do more production than an equivalent manually-operated process.
- Relocate Part sides/top/bottom assembly to beside Bevelling Station to use the 70 - 80% utilised east crane more often (See diagram on the last page of this section).
- Along with Recommendations 14 and 6, relocate Large Leg baffle assembly to beside sides/top/bottom assembly station to use the relocated motorised jib crane and the 70 - 80% utilised East crane more
- Along with Recommendation 15, purchase a spreader bar for 15-tonne lifts so one crane only is used to move assembled Part sides and baffles, and also the joined tops/bottoms.
- To gain further benefits from Recommendation 16 upgrade the three Low Bay cranes from 12.5 Tonne to 15 Tonne capacity so only one crane is needed to lift all large parts of up to 13-tonne weight.
- With the right floor layout, it would become viable to install tram tracks on which jigs and mechanical rotators are mounted so that Part Legs are assembled, rotated and moved between stations on the tracks and no cranes are used at
- Use jigs for all parts needing to be laid-out and tacked, which are made three or more times a year. The cost of making the jig will be recovered in the on-going times saved from no longer measuring, laying-out and tacking and from the additional time saved in machining because of fabrication distortion and
- Schedule all lifts on large parts that take over 4 hours to the weekend and/or night
- Once people are trained in Lean Manufacturing to conduct a thorough investigation into all 7 Lean wastes and categorise them via high-level Pareto and then break the categories down further via a second, low-level Pareto so the problems people lived with can be identified and removed.
- Make it a corporate strategy to replace equipment within 2 years after they have paid for themselves, and so regularly access the latest technology and the most reliable equipment
- Ask Engineering to redesign large items and other large fabricated parts that take a long time to make, to totally remove as many fabrication and machining requirements as possible. There are certain to be simpler designs possible once the production issues the company suffers are advised to the designers.
Methodology
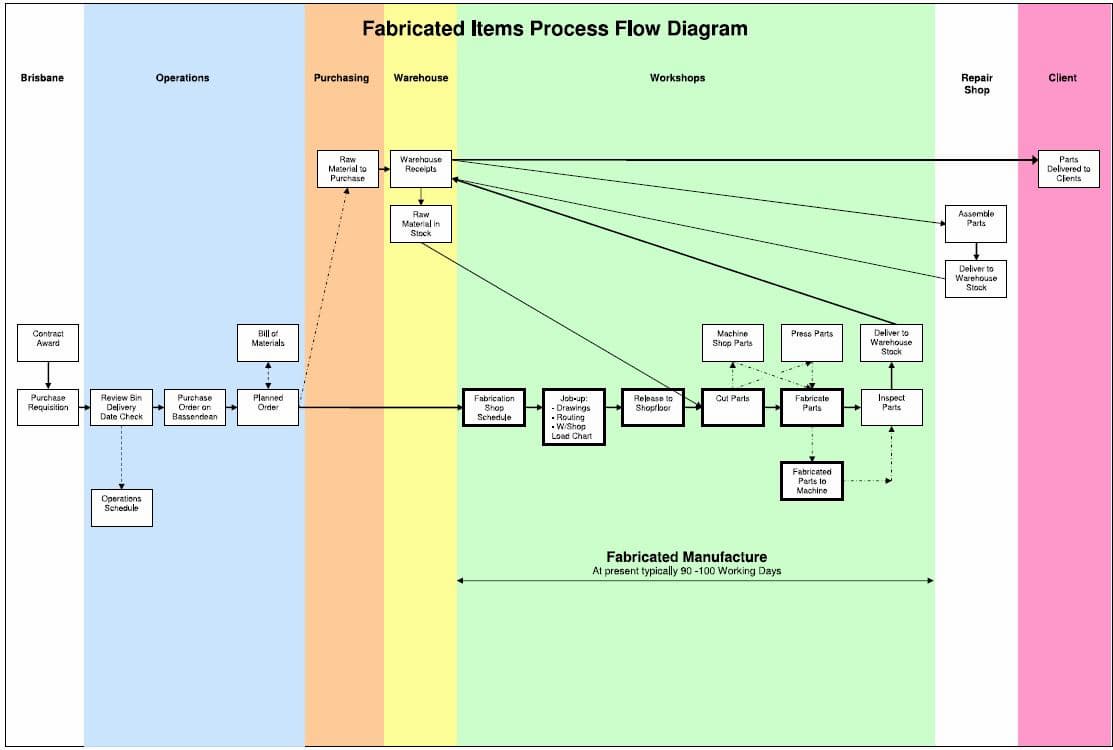
Investigations into improvement opportunities focused on the bolded activities in the Fabrication SIPOC Diagram of Figure 1. These functions are represented by the thick-edged boxes in the Fabricated Items Process Flow Diagram. Opportunities to improve overall velocity also exist in other parts of the process.
The methodology adopted to conduct the investigation was the first three steps of the Lean Six Sigma DMAIC process. In which The Define step was the Velocity Project goal, the Measuring step involved measuring time wastes in the process by using Value Stream Mapping and Contact Diagrams, the Analyse step produced high-level Pareto charts of time usage. The Analysis step remained to be completed in order to identify all the root causes of time use. The Improve step, where solutions to root cause problems are tested, and the Control step, where changes are introduced into the business systems to prevent problems recurring, also remained undone.
|
Fabrication SIPOC Diagram |
||||
| Suppliers | Inputs I Process I Outputs | Customers | ||
|
Machine Shop |
Steel Plate |
Profile Cutting |
Fabricated Components |
Head Office |
| Steel Plate Suppliers | Pressed Parts | Clean-up | Site Construction | |
| Steel Section Suppliers | Labour | Bevelling | Machine Shop | |
|
Welding Consumable |
Drawings | Set-out | Repair Shop
Assembly |
|
| Suppliers | Machined Parts | Assembly | ||
| Warehouse | ||||
| Purchasing | Consumables | Welding (Manual) | ||
| Warehouse | Scheduling | Welding (Sub Arc) | ||
| Operations | Bore Machining and Facing | |||
| Engineering | ||||
| Ultrasonic Inspection | ||||
| Press Shop | ||||
| Visual Inspection | ||||
Figure 1 - SIPOC Diagram for Fabrication
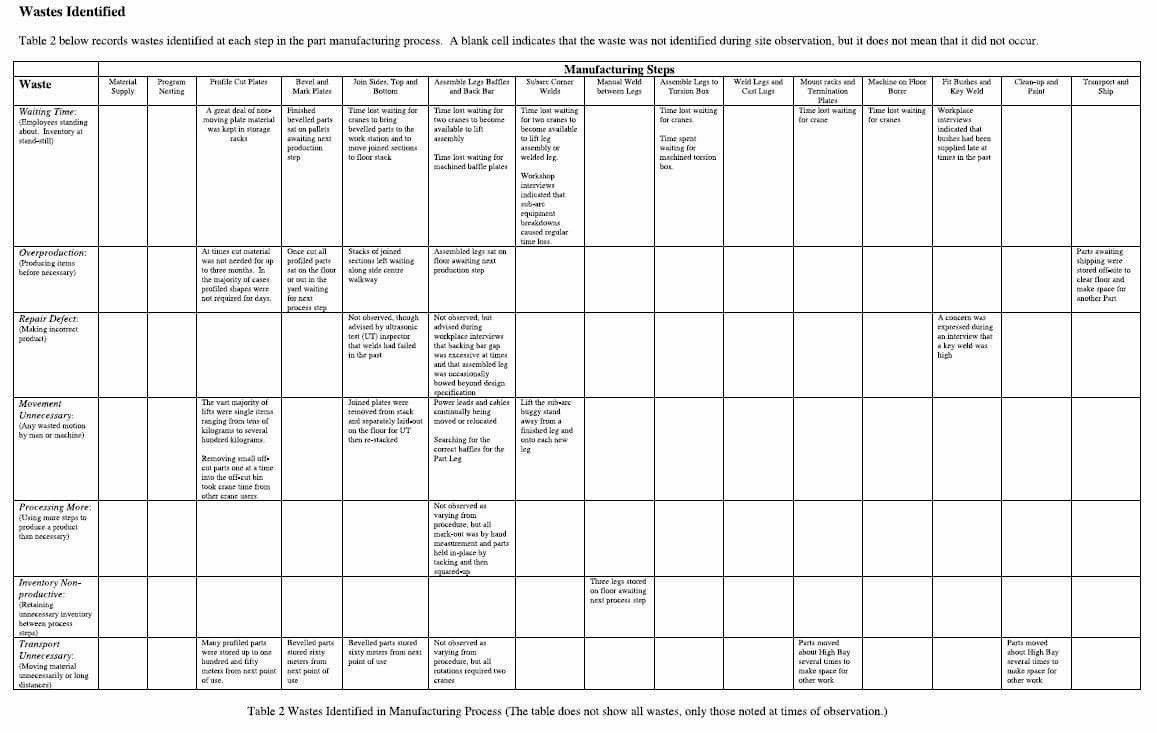
The wastes identified during the Measuring and Analysis steps were any of the seven wastes below:
- Waiting Time: Employees standing about. Inventory at stand-still.
- Overproduction: Producing items before
- Repair Defect: Making incorrect
- Movement Unnecessary: Any wasted motion by man or machine.
- Processing More: Using more steps to produce a product than necessary.
- Inventory Non-productive: Retaining unnecessary inventory between process
- Transport Unnecessary: Moving material unnecessarily or long
The identification of these wastes provides the opportunity for their removal, often at little cost.
Investigation of Part Manufacture
DEFINE Velocity Project
The project aim was to increase manufacturing speed through the fabrication facility by 30%. This was interpreted as reducing fabrication time by 30%.
MEASURE
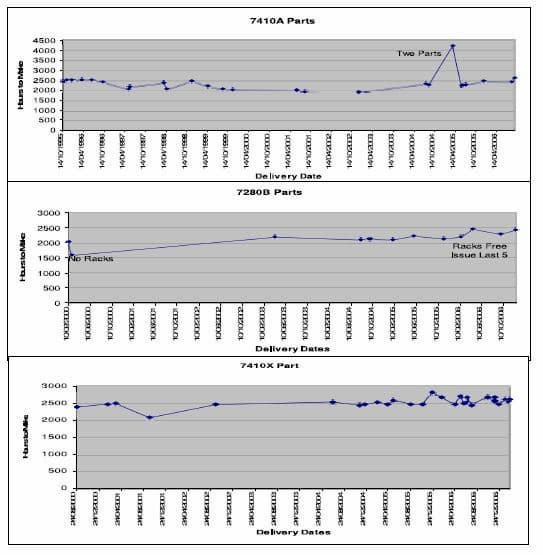
To focus the project, and in recognition of future work scheduled through the Shop, it was decided to examine large parts fabrication. Data collected by the Technical Clerk over the previous decade was converted into graphs of the three most often made parts. It was evident that fabrication times had risen recently.
ANALYSIS
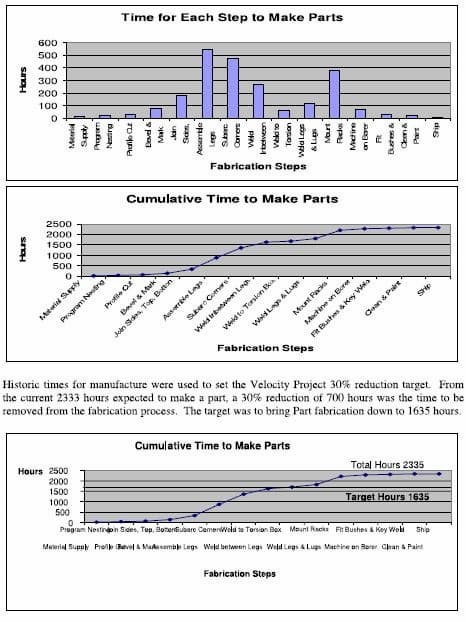
The fabrication step times were displayed as a bar chart (see below) in order to identify those steps taking the most times, on the expectation that they had the greatest potential for time savings.
Root Cause of Time Losses
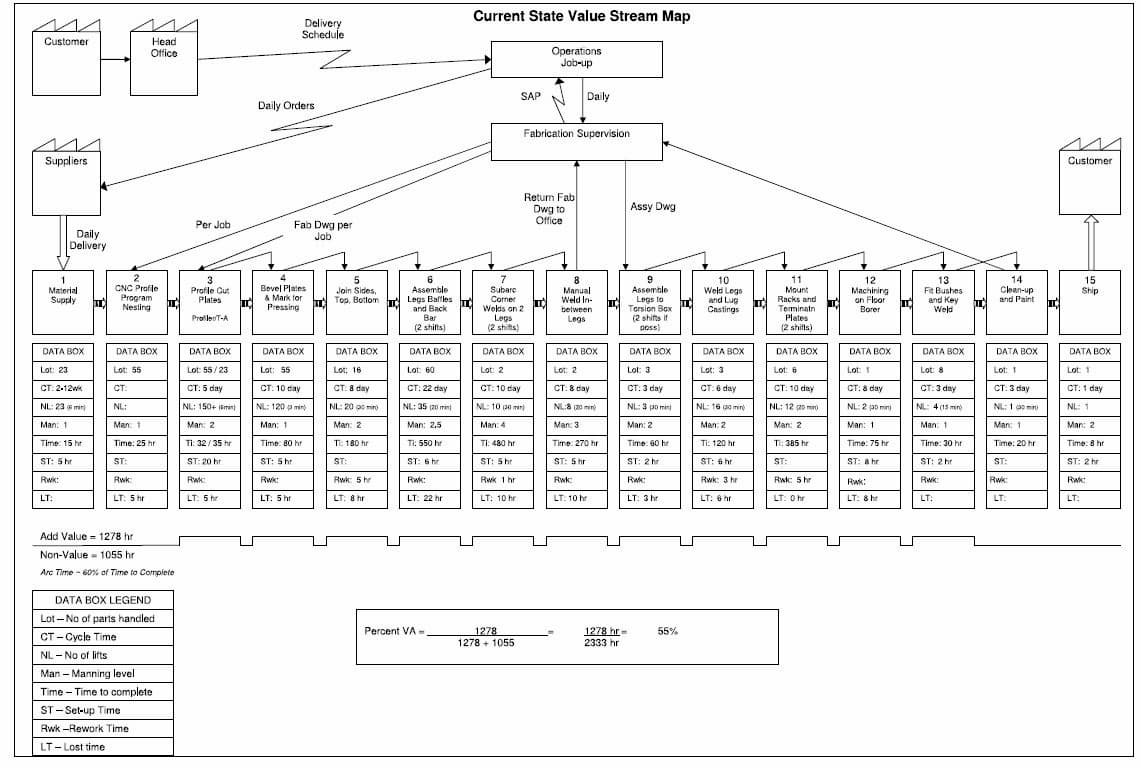
The Value Stream Map identified the time losses categorised in Table 1
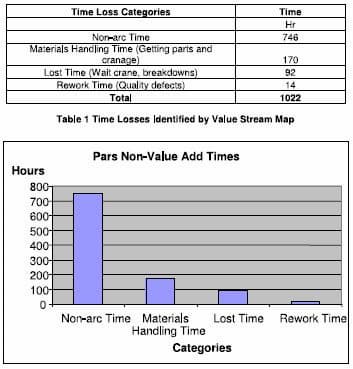
The largest category by far was the 'Non-Arc Time'. Such time included time spent on toilet breaks, getting drinks, washing-up and other such breaks, time spent measuring dimension s, time spent marking-out, time spent fitting parts in-place, time spent moving parts into required alignment, time spent interpreting drawings and getting information, time spent searching for parts, time spent extracting parts from under other parts, time spent moving materials to clear floor congestion or to make space to work, along with other activities required to do the task, but not actually advancing the product to completion.
Unfortunately, no measuring was able to be done of the non-arc time make-up to identify the sizes of the various categories
Table 2 shows the results of a crane usage survey conducted in mid-June 2007. It identified 3 hours crane waiting time for every 45 hours worked in the Low Bay. This equated to 120 hours lost per part in the Low Bay alone waiting for cranes, which was more than the 92 hours estimated by Value Stream Map. The survey result was from actual observation and was expected to be the more reliable count of crane waiting times. If 20 parts were built per year, the lost time waiting for
cranes at the hourly recovery rate would amount to $168,000 per year in the Low Bay alone. To this would need to be added the cost of time lost in the High Bay waiting for cranes.
| Crane Location | Utilisation | Less then 2T Lifts | Man Waiting Time |
| Low Bay | % of Time Used | % of Lifts | Minutes |
| East | 70 - 85% | 40 - 50% | 30 |
| Middle | 80 - 95% | 20 - 40% | 110 |
| West | 80 - 90% | 25 - 50% | 30 |
| High Bay | |||
| East | 50 - 90% | 10% | 0 |
| West | 50 - 90% | 25% | 0 |
| Table 2 Crane Usage Summary During 6.5 Hours of Observation | |||
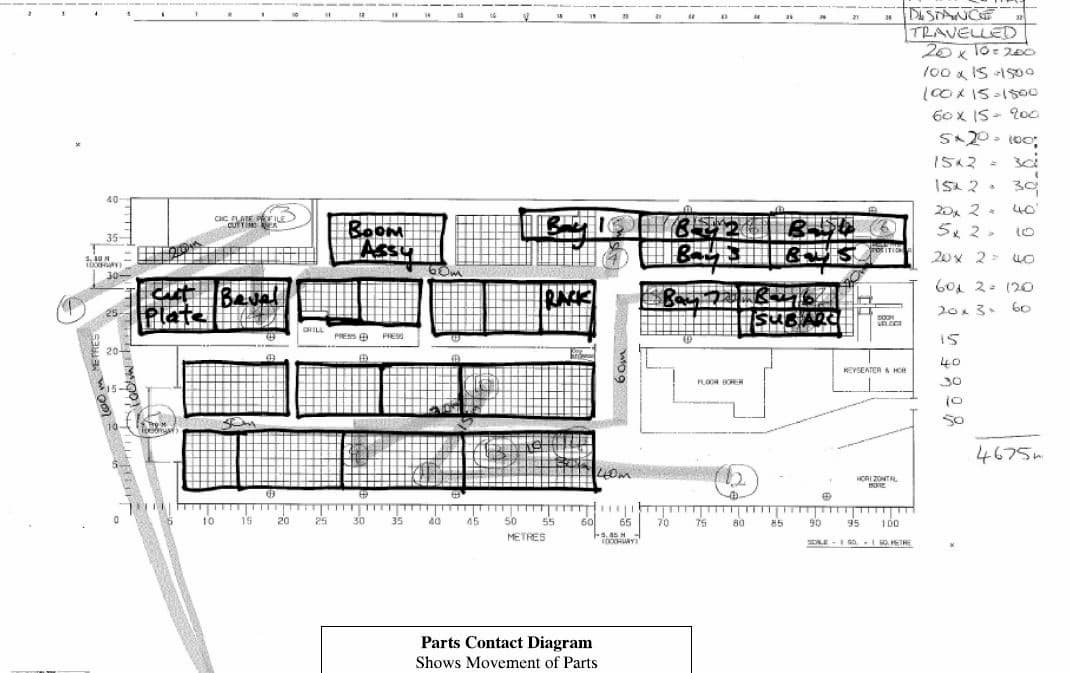
The Contact Diagram below identified some five (5) kilometres of parts transportation per Part.
IMPROVE
This step required the root causes of problems/issues to be identified and proposed changes trialled. It was still to be done.
A proposed floor layout change for discussion was developed, as shown below.
CONTROL
This step required the Improvements to be finalised before making necessary changes to the business processes in order to maintain and sustain the changes. It was still to be done.